Objectives
- To develop artificial neural network (ANN) models using the MATLAB Neural Net Fitting Toolbox.
- To implement ANN models as soft sensors in Simulink and evaluate their predictive performance.
Problem Statement
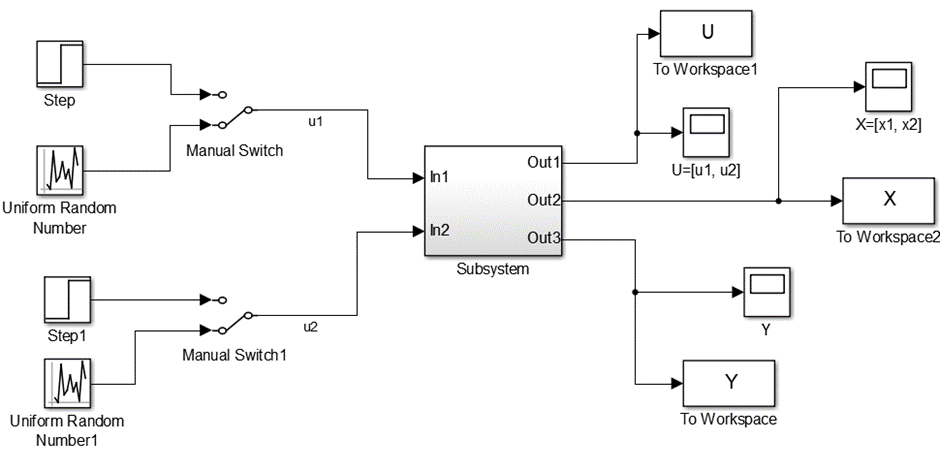
In a distillation column, the distillate product impurity (percentage impurity) is strongly influenced by the column tray temperature and the column differential pressure. Figure 1 shows a Simulink representation of the column, where:
- \(u_1\) = feed flow rate
- \(u_2\) = feed heavy component molar fraction
- \(x_1\) = tray temperature
- \(x_2\) = differential pressure
- \(y\) = distillate percentage impurity
The dynamics of the intermediate variables are given by the following transfer functions:
For tray temperature (\(x_1\)): \[ x_1(s) = \frac{1}{3s + 1} \tag{1}\]
For differential pressure (\(x_2\)): \[ x_2(s) = \frac{0.7s - 0.5}{s^2 + s + 1} \tag{2}\]
The relation between impurity and process variables is nonlinear: \[ y = 2.5 + 0.9x_1 - 0.3x_2 - 0.1x_1x_2 + 0.05x_1^2 - 0.06x_2^2 \tag{3}\]
You wish to develop an ANN model to predict the distillate impurity \(y\) as a function of \(x_1\) and \(x_2\).
For training, use data generated by applying a uniform random number generator (sampling time = 1 unit) to the inputs \(u_1\) and \(u_2\). For testing, use step input sequences applied to \(u_1\) and \(u_2\):
- \(+1\) unit step in \(u_1\) at \(t=1\)
- \(-1\) unit step in \(u_2\) at \(t=20\)
- \(+1\) unit step in \(u_2\) at \(t=30\)
- \(-1\) unit step in \(u_1\) at \(t=65\)
Methodology
- ANN Model Development
- Generate datasets using random inputs for \(u_1\) and \(u_2\).
- Train two ANN models using the Neural Net Fitting Toolbox:
- ANN 1: trained on 100 units of data
- ANN 2: trained on 200 units of data
- ANN 1: trained on 100 units of data
- Vary the number of hidden layers and neurons to find the best model structure.
- Report regression performance (R²), training error, and regression plots.
- Generate datasets using random inputs for \(u_1\) and \(u_2\).
- Implementation in Simulink
- Integrate the trained ANN models into the provided Simulink model of the distillation column.
- Apply the step-change sequence to \(u_1\) and \(u_2\).
- Compare ANN-predicted impurity against the actual nonlinear relation (Eq. \(\ref{eq-3}\)).
- Integrate the trained ANN models into the provided Simulink model of the distillation column.
- Evaluation
- Assess accuracy of ANN 1 vs ANN 2 based on:
- Regression performance (R² values)
- Fit of ANN outputs vs actual impurity under step disturbances
- Regression performance (R² values)
- Comment on the impact of training data size on prediction capability.
- Assess accuracy of ANN 1 vs ANN 2 based on:
Report Format
Your report (5 pages maximum) should include the following:
Submission Details Include a brief table at the beginning of the report with the following information:
Lab Title: Lab 05 - Artificial Neural Networks Student Name ID Unit: CHEN4011 Student 1 12345678 Date: 12 August 2025 Student 2 87654321 Objective & Problem Statement Summarize the purpose of ANN modeling and the context of impurity prediction in distillation.
Methodology & Implementation
- Describe ANN training procedure (datasets, hidden layers, toolbox functions).
- Show regression plots for ANN 1 and ANN 2.
- Report number of hidden layers and R² values.
- Provide Simulink diagrams used for testing.
- Results
- Show simulated responses of predicted impurity vs actual impurity under the defined step-change inputs.
- Present results for both ANN 1 and ANN 2.
- Highlight key differences in prediction accuracy.
- Analysis and Discussion
- Compare performance of ANN 1 and ANN 2.
- Discuss how dataset length and ANN architecture affect prediction accuracy.
- Comment on limitations of using ANN as soft sensors in nonlinear systems.
- Conclusion
- Summarize findings on ANN prediction accuracy.
- State which ANN performed best and why.
- Discuss broader applications of ANN-based soft sensors in process systems.
Assessment Rubric (20 Marks Total)
| No | Section | Marks | Evaluation basis |
|---|---|---|---|
| 1. | Objectives & Problem | 2 | Clarity of problem definition; articulation of objectives |
| 2. | Methodology and Implementation | 6 | ANN training details; Simulink integration; regression plots and R² reporting |
| 3. | Results | 4 | Quality, relevance, and labeling of plots; comparison of ANN 1 vs ANN 2 outputs |
| 4. | Analysis and Discussion | 6 | Insightful interpretation; effect of training size and architecture; limitations |
| 5. | Conclusion and Presentation | 2 | Coherent summary; quality of writing, formatting, and visual presentation |
Citation
@online{utikar2023,
  author = {Utikar, Ranjeet},
  title = {Lab 05: {Artificial} {Neural} {Networks}},
  date = {2023-09-10},
  url = {https://amc.smilelab.dev/content/labs/lab-05/},
  langid = {en}
}